Pictures(:
Logger Lite.
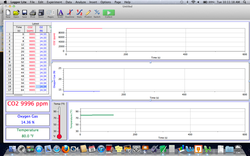
This is a picture of our logger lite program, we are using this program to check our readings everyday. This is the readings from Nov. 20, 2012. It shows graphs of our CO2, Oxygen, and our Temperature. It also shows a temperature gauge, a list of data from every 4 seconds, and an overall official data display. (The picture also shows my dock bar at the bottom of my screen..)
Rock pond.
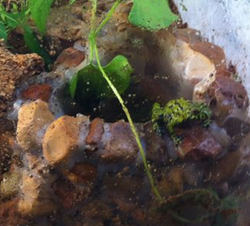
This is a picture of one of my fire bellied toads, both of them love to sit on the edges of the rock pond or even inside the pond. Where they are at in the terrarium usually depends on what the temperature is. They will run around the rest of the ecosystem but if the temperature gets around 82º F. they tend to sit on the pond or under the plants.
NOv. 19, 2012
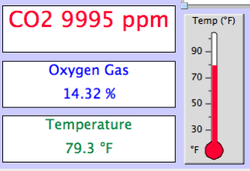
This is a screen shot from logger lite of my readings on Nov. 19, 2012. CO2 is not a percentage yet because it is only in Parts Per Minute. We always convert the CO2 over to a percentage by putting *9995 (since that is what the reading is for that day) over 1,000,000 and then dividing it. Once we have our decimal number we move the decimal to the right two places and BAM you have your percentage.(: In this case you would get .9995%.
Plants(:
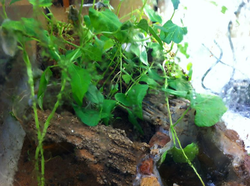
In this picture you can notice most of our plants have grown very well. There are quite a few that tropism has taken over (the process of plants bending and growing towards light sources,) but we have moved our lamps around again today to see if this could possibly fix our problem.
